Optics example
This is the standard optics example provided with the SDDS data. It is like a "TWISS" table from MAD but a bit different since it came from another program.
![]()
![]()
![]()
![]()
![]()
![]()
![]()
| Step | 0 |
| nux | 12.177 |
| dnux/dp | 0. |
| Ax | 0. |
| nuy | 11.2115 |
| dnuy/dp | 0. |
| Ay | 0. |
| Stage | tunes corrected |
| pCentral | 880. |
| dbetax/dp | 0. |
| dbetay/dp | 0. |
| alphac2 | 0. |
| alphac | 0.24367 |
Typicall for optics data, the main information is in the columns, not the arrays.
![]()

![]()
![]()
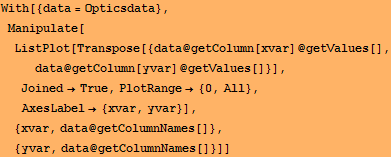
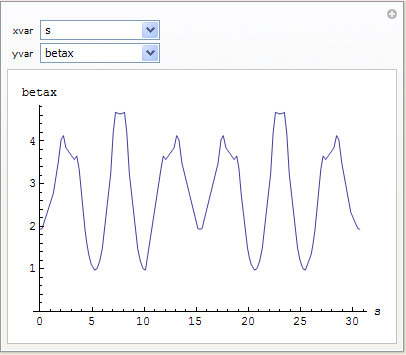
A simple GUI to plot one column against another, labelling the axes appropriately.


![]()
![]()
![]()
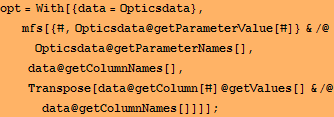
We can transform this optics into the mfs data objects used for many years by the Madtomma packages.

![]()

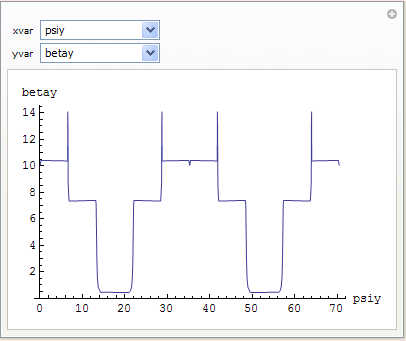
We can build the same simple plotting GUI in the Madtomma style:


| Created by Wolfram Mathematica 6.0 (05 November 2007) |