SPS Beam Loss monitors
Another example
![]()
![]()
![]()
![]()
![]()

![]()
![]()
![]()
![]()
Map a little pure function over the list of parameter names to make a table of them with their values.
![]()
| blrDumpStatus | 479 |
| acqState | 1 |
| deviceName | BLRSPS_BA5 |
| calLosses_unit | 105 |
| acqMsg | What would be a good message ? |
| beamID | 0 |
| cycleName | LHCION |
| totalLoss | 0.0000215264 |
| blrDumpCnt | 1 |
| nbOfMeas | 542 |
| acqDesc | Beamlosses at the end of the cycle |
| hwDumpStatus | 0 |
| cycleLength | 10851 |
| nbOfChannels | 36 |
| totalGain | 12800 |
| calLosses_unitExponent | 0 |
| propType | 2 |
| superCycleNb | 40931 |
| observables | 16 |
How many more lines of code does it take to build a GUI to inspect those values? Answer: zero.


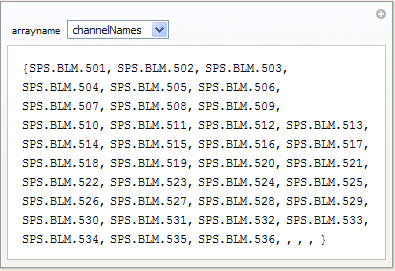
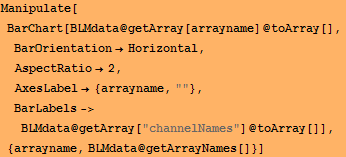
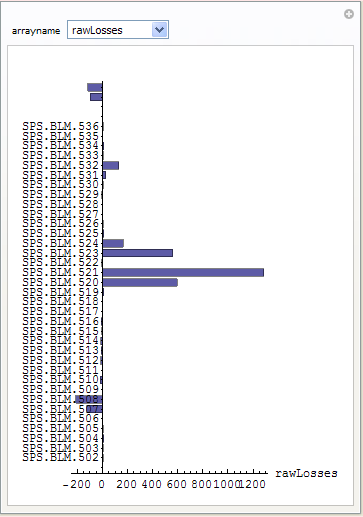
Similarly one can make a GUI to display the contents of the arrays.
![]()

Of course these are trivial examples and more elaborate GUIs can be built with some more code.
![]()


| Created by Wolfram Mathematica 6.0 (05 November 2007) |